The £347 Problem Hiding in Plain Sight
UK retail investors spend hours comparing platform fees and fund charges, agonising over whether to pay 0.15% or 0.22% for a global tracker. Meanwhile, a collection of hidden transaction costs is quietly extracting far more from their ISA portfolios — an average of £347 per year on a typical £20,000 allocation, according to Money Security analysis.
These invisible charges include 0.5% stamp duty on UK shares, bid-ask spreads on ETFs that can reach 0.3%, and currency conversion markups of up to 1.5%. Unlike annual management charges, which appear clearly on fund factsheets, these costs are buried in the mechanics of buying and selling investments.
The Stamp Duty Trap: 0.5% on Every UK Share Purchase
Every time you buy UK-listed shares or UK equity funds in your ISA, HMRC takes 0.5% in stamp duty. On a £2,000 investment in FTSE 100 companies, that's £10 gone before your money even hits the market.
This affects popular ISA holdings differently:
- Direct UK shares: Full 0.5% stamp duty applies
- UK equity funds: Pass the cost through to investors
- UK ETFs: Generally exempt from stamp duty
- Overseas investments: No stamp duty
The practical impact: An investor adding £1,667 monthly to their ISA (the maximum to reach £20,000 annually) and allocating 40% to UK assets faces £40 in stamp duty each year — before considering any other costs.
Bid-Ask Spreads: The Price of Instant Trading
ETFs and investment trusts trade like shares, with a bid price (what you get when selling) and an ask price (what you pay when buying). The gap between them — the spread — represents an immediate cost.
Recent Money Security analysis of popular ISA-eligible ETFs found:
- Vanguard FTSE All-World (VWRL): 0.05-0.15% typical spread
- iShares Core MSCI World (SWDA): 0.08-0.20% typical spread
- iShares Core FTSE 100 (ISF): 0.02-0.08% typical spread
- Smaller sector ETFs: Often 0.2-0.5% spreads
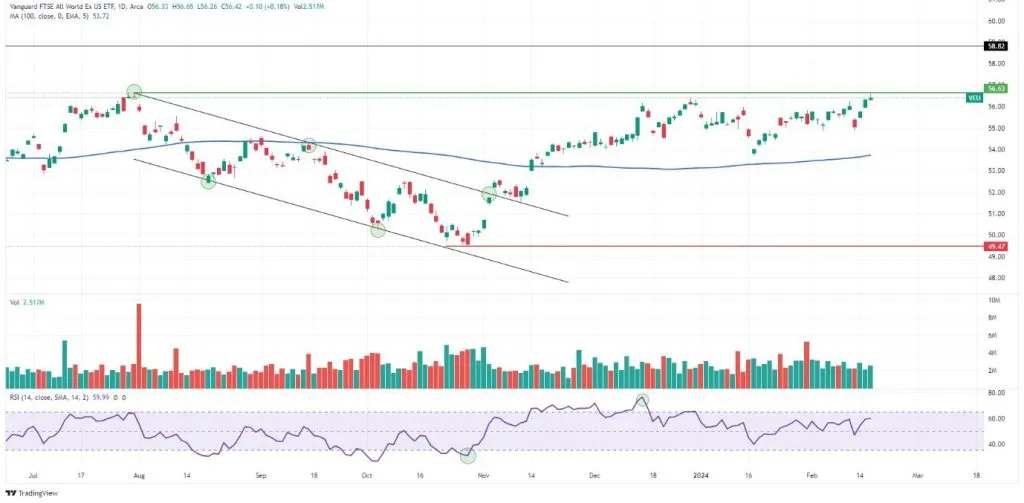 Photo: Vanguard FTSE All-World, via blog.trive.co.za
These spreads widen during volatile markets precisely when many investors want to trade. During the March 2026 market turbulence, some emerging market ETF spreads exceeded 1%.
Currency Conversion: The 1.5% Foreign Exchange Markup
Buying overseas investments requires converting pounds to foreign currency. Platforms handle this differently, and the costs vary dramatically:
Platform FX Markups (typical):
- Hargreaves Lansdown: 1.5%
- AJ Bell: 1.5%
- Interactive Investor: 0.25%
- Trading 212: 0.15%
- Freetrade: 0.45%
 Photo: Hargreaves Lansdown, via seeklogo.com
For an investor putting £500 monthly into US stocks, the difference between the most and least expensive platform is £67.50 annually in FX costs alone.
The Compound Effect: How Hidden Costs Add Up
Consider Sarah, who invests £1,667 monthly across:
- 40% UK equity fund (stamp duty applies)
- 30% US equity ETF (FX conversion required)
- 20% European equity ETF (FX conversion required)
- 10% UK government bonds (no stamp duty)
Annual hidden costs on Hargreaves Lansdown:
- Stamp duty: £40
- FX markups: £150
- Bid-ask spreads: £35
- Total: £225
Same portfolio on Interactive Investor:
- Stamp duty: £40
- FX markups: £25
- Bid-ask spreads: £35
- Total: £100
Platform Strategies: How to Minimise Transaction Costs
Choose ETFs over funds for UK exposure: UK-domiciled ETFs avoid stamp duty while offering identical market exposure to traditional index funds.
Batch your trades: Some platforms charge fixed dealing fees rather than percentages. On these, larger, less frequent trades reduce proportional costs.
Consider accumulating vs income versions: Accumulating funds and ETFs automatically reinvest dividends, avoiding repeated transaction costs on small dividend payments.
Pick platforms with competitive FX rates: Interactive Investor's 0.25% FX markup saves £125 annually versus Hargreaves Lansdown's 1.5% on a £10,000 overseas allocation.
The ISA Deadline Reality Check
With the ISA deadline approaching on 5 April 2026, many investors rush to use their full £20,000 allowance. But lumping everything into expensive transactions can cost more than missing the deadline entirely.
A better approach: use the remaining weeks to research platform costs, not just investment options. The difference between high-cost and low-cost transaction structures compounds over decades.
What to Watch: Platform Fee Wars and Regulatory Changes
The FCA is reviewing platform charging structures in 2026, with particular focus on transparency around transaction costs. Some platforms are already responding by unbundling fees and offering clearer cost breakdowns.
Meanwhile, the Treasury faces pressure to scrap stamp duty on share purchases to boost market liquidity — though any change would likely apply only to new transactions.
The Bottom Line
Hidden transaction costs aren't glamorous, but they're real. Over 20 years, the difference between high-cost and low-cost transaction structures can exceed £10,000 on a typical ISA portfolio — money that compounds in your pocket rather than disappearing into the financial system's machinery.
This article is for informational purposes only and does not constitute financial advice. Your capital is at risk. Past performance is not a reliable indicator of future results.